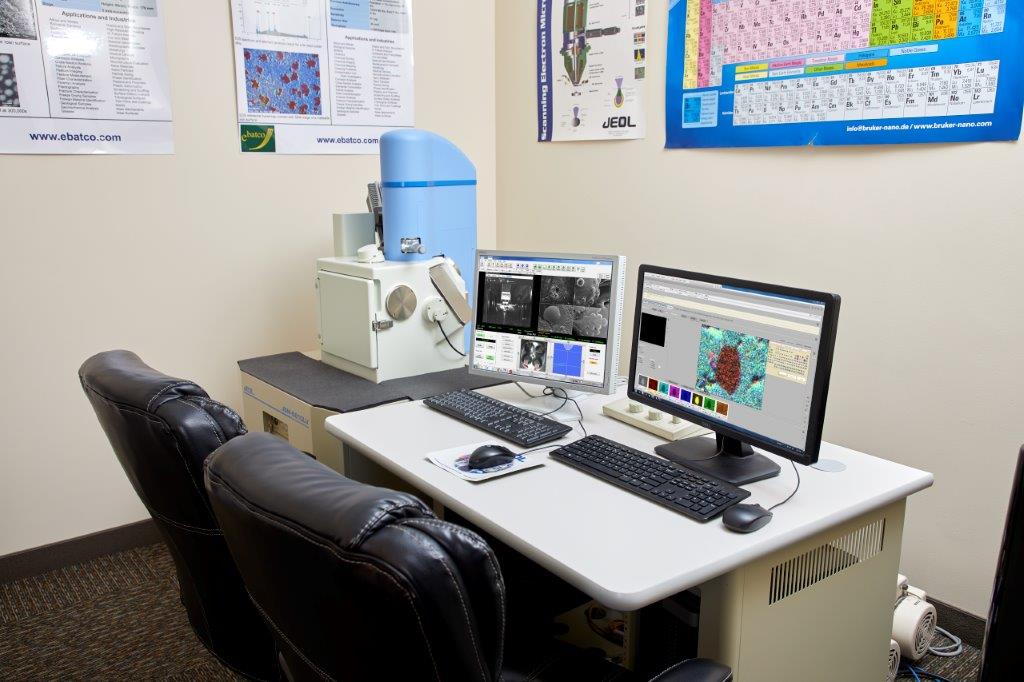
Metals and alloys are some of the most widely used materials in manufacturing today due to their high strength, reliable properties, and processability. Metals and alloys are commonly used in construction, medical devices, small part manufacturing, and many other applications. Our NAT lab can perform alloy phase identification and element distribution analysis using scanning electron microscopy (SEM) and x-ray energy dispersive spectroscopy (EDS). We have an STA 449 F3 Jupiter Thermal Analyzer, which can perform differential scanning calorimetry (DSC) and thermogravimetric analysis (TGA) simultaneously. The Jupiter Thermal Analyzer can precisely measure the temperature of a phase transformation or decomposition up to 1650 °C.
Typical Experimental Results
SEM image of a Zinc-Aluminum alloy composed of a lamellar eutectic α phase (dendrite network) and a zinc-rich η phase.
Backscatter electron image of a Zinc-Aluminum alloy. The brighter regions are the Zinc rich phase, the dull gray regions are the Aluminum rich phase, and the black regions are voids within the casting.
SEM/EDS image of a cast Zinc-Aluminum part with Nickel and Chromium coatings.
Applications
Alloys | Ceramics | Chemical Etching | Cross-Section Analysis | Crystal Structures |
Diffusion Layer | Element Distribution | Element Identification | Failure Analysis | Foreign Material Identification |
Forensic Analysis | Fractography | Fracture Study | Grain Boundaries | Grain Growth |
Grain Orientation | Grain Size | Grain Structure | Grains | IC Failure Analysis |
Materials | Metallography | Metallurgy | Metals | Microscopy |
Microstructure | Phase Diagram | Phase Distribution | Steels | Welds |
For more information please read our application notes:
Identify Unknown Coating and Materials by Energy Dispersive Spectroscopy, PDF
Micro Porosity Measurement of Zn-Al alloy Casting
Phase Identification and Distribution Analysis by Backscattered Electrons Imaging
Instruments: JEOL 6610 LV Scanning Electron Microscope
Key Specifications
Filament | W hairpin filament |
Resolution | High Vacuum: 3nm (30kV), 8nm (3kV), 15nm (1kV) Low Vacuum: 4 nm (30kV) |
Accelerating Voltage | 300 V to 30 kV |
Magnification | 5x to 300,000x |
LV Detector | Multi-segment BSED |
LV Pressure | 10 to 270 Pa |
Sample Sizes | Height: 80mm; Width: 178 mm |
Stage | Eucentric 5 axis motor control, asynchronous movement, x-y: 125mm-110mm, z: 5mm-8mm, tilt:-10 to 90 degrees, rotation: 360 degrees |
Resolution | 5120 x 3840 pixels |
Condenser Lens | Zoom condenser lens |
Objective Lens | Conical objective lens |
Identify Unknown Coating and Materials by Energy Dispersive Spectroscopy
Have some unknown samples? We can help you to determine what they are and where they came from. X-ray Energy Dispersive Spectroscopy (EDS) is a semi-quantitative x-ray technique that can identify and measure chemical composition in SEM analysis. Figure 1 shows the principle of EDS. The SEM focuses an electron beam on the sample surface. The electrons knock core-shell electrons out of atoms inside the sample. To fill this vacancy, a higher energy electron from the atom will fall down to take its place, and the difference in energy between the two states is emitted as an x-ray. The generated x-rays possess energies unique to the element which are dependent upon the atomic number (Z) and the orbital transition involved. Measuring the spectrum of emitted x-ray allows for chemical characterization of the sample.
Figure 1. A representation of the principle behind EDS. this project, an automotive emblem of unknown composition was analyzed by SEM/EDS. EDS can measure the composition at a single point, along a line, or map an area. In this case, the chemical composition was analyzed by EDS area scanning following ASTM E1508 – 12a using an accelerating voltage of 15 kV, take-off angle of 35º, and sample tilt of 0º. The test was performed using a standardless method with P/B-ZAF matrix correction. Figure 2 shows a typical microstructure and the resulting EDS spectrum. Five randomly selected areas at 200X magnification were analyzed by EDS.
Figure 2. Typical microstructure and EDS spectrum result of unknown sample
Through EDS, we found that this sample is mainly composed of Zn with Al as an alloying element. The elemental concentrations were calculated by difference, and the K lines were selected to do the quantitative analysis. Table 1 lists the individual and average EDS results. The average concentrations of Zn and Al are 93.8 and 6.2 wt% respectively, which is a common composition for zinc die castings. Zn alloys have excellent finishing characteristics for plating, and chromate treatments. It is low cost, has excellent thin wall capabilities, and possesses high strength and hardness.
Table 1: Chemical compositions of an automotive emblem by EDS analysis
area 1 area 2 area 3 area 4 area 5 average Zn (wt%) 92.0 94.8 94.2 94.0 94.1 93.8 Al (wt%) 8.0 5.2 5.8 6.0 5.9 6.2 EDS can also do high resolution composite element mapping. Through the element map, we can see a detailed overview of where the different elements are located. Figure 3 clearly indicates that there were three layers of coating on the emblem. The innermost layer in direct contact with the Zn-Al substrate was identified as Cu. The middle layer was Ni, and the outermost layer was Cr. This coating was likely prepared by an electroplating process where the Cu layer facilitated the formation of a good Ni coating. This is a common processing step for electroplating Ni onto cast metal parts. The thicknesses of the Ni and Cr coatings are approximately 20 and 2 µm, respectively.
Figure 3. Element mapping images of unknown sample’s coating.
ASTM Number |
Title |
Website Link |
A247 – 06e1 | Standard Test Method for Evaluating the Microstructure of Graphite in Iron Castings | Link |
A262 – 15 | Standard Practices for Detecting Susceptibility to Intergranular Attack in Austenitic Stainless Steels | Link |
A763 – 93(2009) | Standard Practices for Detecting Susceptibility to Intergranular Attack in Ferritic Stainless Steels | Link |
A802 – 95(2015) | Standard Practice for Steel Castings, Surface Acceptance Standards, Visual Examination | Link |
A892 – 06 | Standard Guide for Defining and Rating the Microstructure of High Carbon Bearing Steels | Link |
B276 – 05(2015) | Standard Test Method for Apparent Porosity in Cemented Carbides | Link |
B487 – 85(2013) | Standard Test Method for Measurement of Metal and Oxide Coating Thickness by Microscopical Examination of Cross Section | Link |
B578 – 87(2015) | Standard Test Method for Microhardness of Electroplated Coatings | Link |
B657 – 05 | Guide for Metallographic Identification of Microstructure in Cemented Carbides | Link |
B748 – 90(2016) | Standard Test Method for Measurement of Thickness of Metallic Coatings by Measurement of Cross Section with a Scanning Electron Microscope | Link |
B796 – 02 | Standard Test Method for Nonmetallic Inclusion Content of Powders Intended for Powder Forging (P/F) Applications | Link |
E1508 – 98(2008) | Standard Guide for Quantitative Analysis by Energy-Dispersive Spectroscopy | Link |
E3 – 01(2007)e1 | Standard Guide for Preparation of Metallographic Specimens | Link |
E340 – 00(2006) | Standard Test Method for Macroetching Metals and Alloys | Link |
E381 – 01(2012) | Standard Method of Macroetch Testing Steel Bars, Billets, Blooms, and Forgings | Link |
E384 – 09 | Standard Test Method for Microindentation Hardness of Materials | Link |
E384 – 10e2 | Standard Test Method for Knoop and Vickers Hardness of Materials | Link |
E407 – 07(2015)e1 | Standard Practice for Microetching Metals and Alloys | Link |
E45 – 05e3 | Standard Test Methods for Determining the Inclusion Content of Steel | Link |
E562 – 11 | Standard Test Method for Determining Volume Fraction by Systematic Manual Point Count | Link |
E7 – 03(2009) | Standard Terminology Relating to Metallography | Link |
E768 – 99(2010)e1 | Standard Guide for Preparing and Evaluating Specimens for Automatic Inclusion Assessment of Steel | Link |
E930 – 99(2015) | Standard Test Methods for Estimating the Largest Grain Observed in a Metallographic Section (ALA Grain Size) | Link |
ISO Number | Title | Website Link |
209:2007 | Aluminium and aluminium alloys — Chemical composition | Link |
3887:2017 | Steels — Determination of the depth of decarburization | Link |
4499-1:2008 | Hardmetals — Metallographic determination of microstructure — Part 1: Photomicrographs and description | Link |
4499-4:2016 | Hardmetals — Metallographic determination of microstructure — Part 4: Characterisation of porosity, carbon defects and eta-phase content | Link |
5949:1983 | Tool steels and bearing steels — Micrographic method for assessing the distribution of carbides using reference photomicrographs | Link |
643:2012 | Steels — Micrographic determination of the apparent grain size | Link |
6872:2015 | Dentistry — Ceramic materials | Link |
9220:1988 | Metallic coatings — Measurement of coating thickness — Scanning electron microscope method | Link |