Ebatco’s JEOL 6610LV SEM is equipped with a Bruker XFlash 6|30 Energy Dispersive X-Ray Spectrometer (EDS) system, which expands the capabilities of the SEM to rapid qualitative and quantitative element identification and chemical analysis. This EDS system measures characteristic X-rays emitted from the sample during the bombardment by an electron beam. The energy spectra of X-rays and their counts reveal the elemental composition of the analyzed volume. Working in tandem, the SEM and EDS link the surface morphology with its chemical composition.
The EDS system is highly efficient, versatile and powerful. With a 30 mm2 silicon drift detector, over 1500 kcps count rate, improved heat sink and maximum solid angle, the EDS system is optimal for both microanalysis and spectral imaging. Its high input count rate allows for faster analysis. Its live quantification in intervals of 100 milliseconds or less is convenient for recognizing changes in the spectrum across a sample.
Feature Analysis
Point analysis and line scans are some of the analysis features available on this EDS system in which specimens are analyzed at a point or along a selected line. Point analysis measures the elemental composition of the spot while line scan shows an elemental concentration profile along the line.
In addition to point analysis and line scans, advanced features like object analysis can be performed on this EDS system. During the object analysis, continuous electron beam scan moves over the object’s area, thereby reducing strain and possible beam effect on the sample. Multi-object analysis, a combination of multipoint and object analysis can be carried out as well. This feature allows different spots or areas on the sample to be analyzed automatically.
Spectral Mapping
Basic elemental map can be generated to show the concentration distribution of different elements in the sample using virtual colors.
Position tagged spectrometry (Hypermap) is an advanced mapping technique that stores complete spectra for every pixel on the map. It permits the user to conduct data analysis post processing. It is useful when working with samples that require phase reconstruction, feature recognition, or are inhomogeneous. With a generated hypermap, one can perform point analysis, line profiling, elemental mapping and quantitative analysis without re-run the sample.
Qualitative Analysis
The energies of the emitted X-ray lines under electron beam scan are specific to each element in the sample and they are almost independent of chemical bonding of atoms. Therefore, the X-rays are characteristic in nature and can be used to determine or identify elements in a sample with unknown compositions. Qualitative analysis of samples using EDS for elements with atomic numbers above beryllium is easy, fast, non-destructive and widely-used.
Quantitative Analysis
Quantitative analysis can be performed using EDS by counting the x-rays at the characteristic energy levels for each element. Standardless, standard-based, direct reference, or combined methods may be used to analyze the acquired data. Generally, accuracy for standard based analysis can be fine-tuned to about 1%. Compared to the standardless method, the standard-based quantification yields the highest possible accuracy. However, standard-based measurements involve considerably more effort. Direct reference based analysis compares a sample against an available standard or a reference sample. It reduces the need for a standard library while obtaining reliable results even on powders or ceramics.
True standardless analysis available on the Bruker EDS system is a unique P/B-ZAF based quantification method. This method relies on peak-to-background ZAF evaluation (P/B-ZAF) and provides reliable quantification results for all types of samples. The P/B-ZAF algorithm is based on a physical model using information obtained from bremsstrahlung background radiation as an internal standard for quantification. Peak-to-background (P/B) ratios used for calculating quantitative data are more robust than net intensities used by other standardless analysis algorithms.
Typical Experimental Results
EDS spectrum and element analysis result for a tin-lead solder alloy; measured weight ratio of 60.45:39.55 is very close to its label ratio of 60:40.
EDS Hypermap of a tin-lead solder alloy; showing the primary Pb-rich α phase at the centre and the surrounding lamellar Sn-rich eutectic phase
EDS elemental hypermap overlaid with SEM image of a malleable iron surface; showing blue ferrite matrix with red spheroids of graphite and scattered green spots of manganese
SEM image of a PTFE coated stainless steel guide wire after coating scratch failure test; scratch direction: left to right; scratch tip: 2µm diameter, cono-spherical diamond tip
EDS elemental concentration profiles along the red scan line in Zone 1 of the scratched PTFE coated stainless steel guide wire; the increasing of Fe and decreasing of C and F clearly identifies the beginning of the PTFE coating delamination from the stainless steel substrate
SEM images (top) and EDS elemental Hypermaps (bottom) of Zones 2-4 of the scratched PTFE coated stainless steel guide wire; C (blue), F (yellow) and Fe (red)
Applications
Alloys and Metals | Biofilms | Biological Samples | Ceramics | Chemical Etching |
Chemical Imaging | Cleaning Problems | Contamination and Stain Investigation | Corrosion Analysis | Cross-section Analysis |
Failure Analysis | Feature Imaging | Feature Measurement | Fiber Characterization | Foreign Material Identification |
Forensic Analysis | Fractography | Fracture Characterization | Freeze Drying Samples | Geochemical Analysis |
Geological Samples | Glasses | Grains and Grain Boundaries | Gunshot Residue | IC Failure Analysis |
Iron and Steel | Material Identification | Medical Devices | Metallographic Analysis | Metallurgy |
Micrographs | Microstructure Evaluation | Nano Materials | Nano Particles | Particle Sizing |
Phase Identification | Plastic Deformation | Plastics and Polymers | Scratch and Scuffing | Surface Defect Analysis |
Thin Films and Coatings | Tribological Surfaces | Wear Mechanisms | Wear Surfaces | Welds |
For more information please read our application notes:
SEM EDS Analysis of Bicentennial Penny Patina, PDF
SEM EDS Analysis on Scratch Failure of PTFE Coated Stainless Steel Guide Wire, PDF
Instruments: EDS BrukerXFlash 6|30 SDD
Instrument Key Specifications
Detection Limit | 0.1% mass concentration |
Precision and Accuracy | Precision: < 1%; Accuracy: 3-5% |
Resolution | 123eV Mn Kα, 53eV F Kα, 45eV C Kα |
Sensitivity | 0.1 pg |
Detector Size | 30 mm2 |
Throughput | >1500 kcps input rate |
SEM EDS Analysis of Bicentennial Penny Patina
The process and nature of corrosion is of utmost importance across a wide array of fields. Knowing the properties of the corroded material is a crucial step in gaining an understanding as to why and how the corrosion occurred. Corrosion can take on various forms and behaviors even within a small area of a given material, so being able to examine a specific point on the sample is greatly useful in the analysis of the corrosion.
One method for analyzing corrosion is by means of a SEM (Scanning Electron Microscopy) equipped with EDS (Energy Dispersive X-ray Spectroscopy). Working in tandem, SEM and EDS analyses can reveal a tremendous amount of useful information on corrosion processes and mechanisms, as well as material anti-corrosion properties. With the SEM system, micrographs can be taken for morphological inspection to understand how the corrosion surface is forming and changing. Pits, cracks, fractures and other microscopically observable characteristics of the corroded materials are useful to visualize what may have happened. In addition to SEM observations, the EDS system can further assist in identifying and quantifying the chemical compositions of the micro areas of interest by measuring the characteristic X-rays produced by atoms that are present in the lattice of the material when excited by electron bombardment. To obtain quick and accurate results, the EDS system in use operates using a peak to background ZAF algorithm analysis technique. This method utilizes the Bremsstrahlung X-rays created to calculate fundamental peak to background ratios which are then used to analyze the detected peak characteristic X-rays from the sample. This analysis procedure provides accurate results without the need for calibration using reference standards.
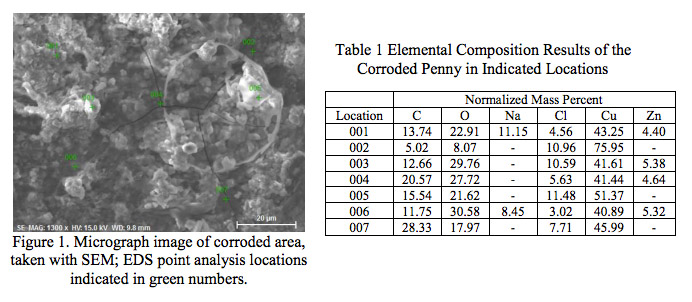
As an example to illustrate the above points, a corroded penny of 1976 was briefly studied in our JEOL JSM-6610LV SEM with Bruker QUANTAX 200 EDS system. A SEM micrographic image was taken on a green colored area and EDS compositional spectra were taken at several points as indicated by the numbers in Figure 1. The elements found in the corroded points are listed in Table 1. Figure 2 shows a typical EDS spectrum of the corroded area.
From the SEM image, it is obvious that the corroded area has characteristics of severe metal corrosion: uneven, porous and powdery microstructure, and cracks on the surface caused by corrosion stresses. The EDS compositional analysis has indicated that three main elements in the majority of locations are copper, oxygen, and carbon. It is suspected that these elements are existing in the forms of copper (I) carbonate or copper (II) carbonate as the results of penny corrosion. Some small amounts of zinc, the alloying material used in pennies produced between 1962 and 1982, such as the 1976 penny we examined, were also detected in some of the locations. In addition, all analyzed locations show some amounts of chlorine. This could be evidence of copper or zinc chlorides present due to corrosion. Furthermore, the presence of sodium suggests some amount of sodium chloride, likely due to sweat deposited on the surface when handling of the penny.
SEM EDS Analysis on Scratch Failure of PTFE Coated Stainless Steel Guide Wire
Coatings are used on a wide variety of substrates such as metals, alloys, semiconductors, polymers, biomedical devices for decorative or functional purposes. The adhesion behaviors of coatings are essential to their applications. Scratch test is one of the broadly used, fast, and effective methods to evaluate coating adhesion properties. During a scratch test, a stylus or scratch tip gradually penetrates into a coating under a progressive load while it also moves across the coating sample. The normal load at which the coating fails due to delamination or other separation mechanisms is called the critical load of interfacial adhesion failure. The critical load of interfacial adhesion failure is related to the practical adhesion strength of the coating to the substrate. One complementary technique for analyzing scratch failure of coating is Scanning Electron Microscopy (SEM) equipped with Energy Dispersive X-ray Spectroscopy (EDS). Working in tandem, SEM and EDS analyses can reveal a tremendous amount of useful information on scratch failure processes and mechanisms, as well as material anti-scratch properties. With the SEM system, micrographs can be taken for morphological inspection in order to understand how the scratch surface is forming and changing. The SEM micrographs of the scratch surfaces can reveal much more details as a result of SEM’s larger depth of field, higher resolution and greater magnification than the optical microscope available on a scratch tester. In addition to SEM observations, the EDS system can further assist in identifying and quantifying the chemical compositions of the micro areas of interest by measuring the characteristic X-rays produced by atoms that are present in the coating and substrate materials.
PTFE coated stainless steel guide wires are popular in many medical applications. PTFE coatings are applied to the wire surface for smooth surface finish, reduced friction, increased lubricity and durability of the guide wire. Obviously the PTFE coating adhesion to the guide wire is critical not only for the desired functionalities but also for the health and safety of the patient to whom the guide wire is to be used. An undesired issue would be flaking of the coating material due to adhesion problems, which could lead to blockage of a passage or clogging of blood vessels. Figure 1 is an SEM image of a PTFE coated stainless steel guide wire after scratch test. Blue color box Zone 1 includes scratch before interfacial adhesion failure, transitional Zone 2 in which adhesion failure occurred, steady scratch Zone 3 and scratch end Zone 4. The bright scratch track in Zones 2-4 indicates non-existence of the PTFE coating and exposure of the stainless steel substrate.
Figure 2 shows the elemental profiles of Zone 1 with the EDS line scanning across the entire scratch. The EDS compositional analysis has verified the morphological interpretations of the SEM image; the coating has indeed delaminated in Zone 2 where element Fe from stainless steel substrate increases and C and F from the PTFE coating decreases. The zoom-in SEM images and EDS elemental Hypermaps of the Zones 2-4 presented in Figure 3 provides further details of the elemental distributions of the coating and substrate materials along the scratch.
ASTM Number | Title | Website Link |
E1508-12a | Standard Guide for Quantitative Analysis by Energy-Dispersive Spectroscopy | Link |
E1588-10e1 | Standard Guide for Gunshot Residue Analysis by Scanning Electron Microscopy/Energy Dispersive X-Ray Spectrometry | Link |
F1375-92 | Standard Test Method for Energy Dispersive X-Ray Spectrometer Analysis of Metallic Surface Condition for Gas Distribution System Components | Link |
C1255-11 | Standard Test Method for Analysis of Uranium and Throium in Soils by Energy Dispersive X-Rary Fluorescence Spectroscopy | Link |
D6481-14 | Standard Test Method for Determination of Phosphorus, Sulfur, Calcium, and Zing in Lubrication Oils by Energy Dispersive X-Ray Fluorescence Spectroscopy | Link |
D4294-16e1 | Standard Test Method for Sulfur on Petroleum and Petroleum Products by Energy Dispersive X-Ray Fluorescence Spectrometry | Link |
D5839-15 | Standard Test Method for Trace Element Analysis of Hazardous Waste Fuel by Energy Dispersive X-Ray Fluorescence Spectrometry | Link |
D6052-97 | Standard Test Method for Preparation and Elemental Analysis of Liquid Hazardous Waste by Energy Dispersive X-Ray Fluorescence | Link |
D7220-12 | Standard Test Method for Sulfur in Automotive, Heating, and Jet Fuels by Monochromatic Energy Dispersive X-Ray Fluorescence Spectrometry | Link |
D7212-13 | Standard Test Method for Low Sulfur in Automotive Fuels by Energy Dispersive X-Ray Fluorescence Spectrometry Using a Low-Background Proportional Counter | Link |
F3078-15 | Standard Test Method for Identification and Quantification of Lead in Paint and Similar Coating Materials using Energy Dispersive X-Ray Fluorescence Spectrometry | Link |
F2617-15 | Standard Test Method for Identification and Quantification of Chromium, Bromine, Cadmium, Mercury, and Lead in Polymeric Material Using Energy Dispersive X-Ray Fluorescence Spectrometry | Link |
F2853-10 | Standard Test Method for Determination of Lead in Paint Laers and Similar Coatings or in Substrates and Homogenous Materials by Energy Dispersive X-Ray Fluorescence Spectrometry Using Multiple Monochromatic Excitation Beams | Link |
D5381-93 | Standard Guide for X-Ray Fluorescence Spectroscopy of Pigments and Extenders | Link |
D7639-10 | Standard Test Method for Determination of Zirconium Treatment Weight or Thickness on Metal Substrates by X-Ray Fluorescence | Link |
C1456-13 | Standard Test Method for Determination of Uranium or Gadolinium (or both) in Gadolinium Oxide-Uranium Oxide Pellets or by X-Ray Fluorescence | Link |
C1254-13 | Standard Test Method for Determination of Uranium in Mineral Acids by X-Ray Fluorescence | Link |
D4326-13 | Standard Test Method for Major and Minor Elements in Coal and Coke Ash by X-Ray Fluorescence | Link |
B890-07 | Standard Test Method for Determination of Metallic Consituents of Tungsten Alloys and Tungsten Hardmetals by X-Ray Fluorescence Spectrometry | Link |
E1085-09 | Standard Test Method for Analysis of Low-Alloy Steels by X-Ray Fluorescence Spectrometry | Link |
D1619-16 | Standard Test Methods for Carbon Black– Sulfur Content | Link |
C1271-99 | Standard Test Method for X-Ray Spectrometric Analysis of Lime and Limestone | Link |
D6502-10 | Standard Test Method for Measurement of On-line Integrated Samples of Low Level Suspended Solids and Ionic Solids in Process Water by X-Ray Fluorescence | Link |
E539-11 | Standard Test Method for Analysis of Titanium Alloys by X-Ray Fluorescence Spectrometry | Link |
B568-98 | Standard Test Method for Measurement of Coating Thickness by X-Ray Spectrometry | Link |
D7343-12 | Standard Practice for Optimization, Sample Handling, Calibration, and Validation of X-Ray Fluorescence Spectrometry Methods for Elemental Analysis of Petroleum Products and Lubricants | Link |
D7085-04e1 | Standard Guide for Determination of Chemical Elements in Fluid Catalytic Cracking Catalysts by X-Ray Fluorescence Spectrometry (XRF) | Link |
E1361-02e1 | Standard Guide for Correction of Interelement Effects in X-Ray Spectrometric Analysis | Link |
D7751-14e1 | Standard Test Method for Determination of Additive Elements in Lubricating Oils by EDXRF Analysis | Link |
C1343-11 | Standard Test Method for Determination of Low Concentrations of Uranium in Oils and Oragnic Liquids by X-Ray Fluorescence | Link |
E2809-13 | Standard Guide for Using Scanning Electron Microscopy/X-Ray Spectrometry in Forensic Paint Examinations | Link |
ISO Number | Title | Website Link |
20847 | Petroleum products– Determination of sulfur content of automotive fuels– Energy-dispersive X-ray fluorescence spectrometry | Link |
10798 | Nanotechnologies– Characterization of single-wall carbon nanotubes using scanning electron microscopy and energy dispersive X-ray analysis | Link |
22309 | Microbeam analysis– Quantitative analysis using energy-dispersive spectrometry (EDS) for elements with an atomic number of 11 (Na) or above | Link |
8754 | Petroleum products– Determination of sulfur content– Energy-dispersive X-ray fluorescence spectrometry | Link |